Friday, August 8, 2008

Star plot

The star plot is used to display data with multiple variables. It is possible to see the distance from zero that each variable goes and determine the variable with the most effect. This star plot is used for oil technologies.


http://www.humble-inc.com/rof_app99-2.htm

Correlation matrix

The correlation matrix shows not only similarities in two data sets, but the degree to which they are similar. It is shown in this matrix using color intensity for higher or lower values.

http://yin.che.wisc.edu/images.htm

Similarity matrix

A similarity matrix allows someone to display corresponding data in a way that is easy to compare and find where the two data sets intersect.

http://tomcat.esat.kuleuven.be/txtgate/tutorial.jsp

Stem and leaf plot

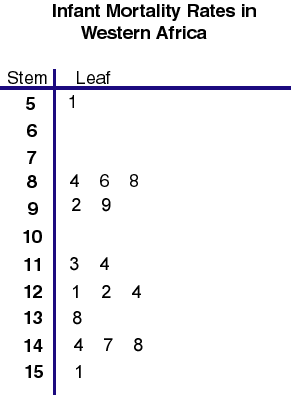
This stem and leaf plot organizes a list of data about infant mortality rates in Western Africa. The data is organized by stem (the first digit), and then by leaf (the corresponding digits). It is then possible to see how many samples share the same first digit, and also what the other digit are.

http://mainland.cctt.org/mathsummer/JosephBond/StemAndPlots/stem-and-leaf_std.htm

Boxplot

This is a simple example of a boxplot. As used in this example, it shows statistics in a graphic manner that represents the median and range. The asterisks represent outlying data.

http://www2.hawaii.edu/~donaldp/Biostatitics/lecture9.htm

Histogram

This histogram shows the frequency of the difference between observed and expected UV indexes at a particular location.

http://www.cpc.ncep.noaa.gov/products/stratosphere/uv_index/uv_validate.shtml

Parallel coordinate graph

This parallel coordinate graph is used to track baseball stats. It is used to graph many variables at once, and shows trends in hits, homeruns, etc.

http://www.matthewtavares.com/baseball_report/

Triangular plot

This soil pyramid is an example of a triangle plot. It graphs three distinct variables at once. This plot is used to determine what a soil is characterized as based on composition.

http://www.glencoe.com/qe/scienceOLC.php?qi=7189

Wind Rose

A wind rose represents wind speed and direction at a location. The size of the bars represents speed and the location shows direction.

http://www.nws.noaa.gov/mdl/pgb/AvnFPS/3.2/html/climate-new.html

Climograph

This is a climograph of Memphis, Tn. The temperature data is shown with a line graph, while the precipitation is shown with a bar graph.

http://www.uwsp.edu/geo/faculty/ritter/glossary/a_d/climograph.html

Population profile

This population profile compares life expectancy in populations with and without AIDS. Data is categorized by age group.

http://www.ifad.org/operations/regional/pf/aids_1.htm

Scatterplot

This scatterplot is a volcano plot, based on the values from a t-test. The data points go in two directions since the data is based on a log function.

http://www.moleculardevices.com/pages/software/gn_acuity.html

Index value plot

This index value plot shows the relationship between what is considered normal streamflow and actual values. The index used is the average streamflow index and values are compared to it along the center line.

http://water.usgs.gov/waterwatch/?m=real&w=plot

Lorenz curve

A Lorenz curve showing the area of inequality in the relationship between percent of population and percent of income.

http://www.unc.edu/depts/econ/byrns_web/Economicae/Figures/Lorenz.htm

Bialateral graph

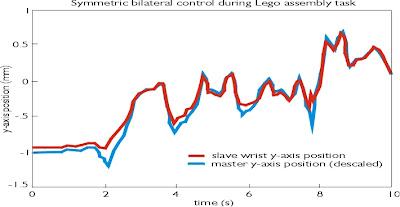
A bilateral graph shows the relationship between two variables. This graph shows the relationship between the controls of a robotic device and the movement caused by those controls.

http://www.msl.ri.cmu.edu/projects/teleop/

Bivariate choropleth map

This is a bivariate choropleth map combines life expectancy and income rates in Africa. The data is from 1989, and shows places of extreme poverty and low life expectancy in light gray.

http://www.geocities.com/stevejford/new_page_2.htm

Unclassed choropleth map

This unclassed choropleth map uses a full range of shading. There are no classes to correlate the data to.

http://www.spokane.wsu.edu/gis/Classes/LA467/mapty.htm

Classed choropleth map

This classed choropleth map shows the relationship of males to females according to the 2000 census data. The classes are darker as the percentage of males to females is larger.

http://www.ilstu.edu/~jrcarter/Geo204/Choro/

Range graded proportional circle map

This is a simple image of a range graded proportional circle map. The area of the circles correspond to the data set the map is showing. The size of the circles has a direct relationship to the data, which is not grouped.

http://instruct.uwo.ca/geog/242/lab11.htm

Continuously variable proportional circle map

This is a series of maps showing parts per million of zinc of a river. The size of the circles is proportional to the amount of zinc at each sampling station.

http://gsc.nrcan.gc.ca/mindep/metallogeny/sedex/selwyn/index_e.php

DOQQ

This is a digital orthoimagery quarter quadrangle(DOQQ) image of Washington D.C. It combines the qualities of an aerial photograph with the georeferencing of a map.

http://seamless.usgs.gov/website/seamless/products/1doqq.asp

DEM

This digital elevation model is of Antartica. It is a visual representation of the elevation of the area using shading.

http://nsidc.org/data/docs/daac/nsidc0304_0305_glas_dems.gd.html

DLG

This is a DLG (digital line graphic) from USGS. A DLG is an image derived from USGS maps.

http://edc.usgs.gov/images/dlg.gif

Digital Raster Graphic

This is a DRG (digital raster graphic), a scanned map that is georeferenced.

http://www.maaamet.ee/data/img/Seinakaart_080606.jpg

Isopleth Map

This map of the U.S. is used by the EPA to determine the amount of acid rain in areas of the country. The colors and numbers shows pH levels in the rain taken in 1999.

http://www.epa.gov/CASTNET/images/ph_map.gif

Isohyetal Map

This map of Australia shows areas of equal precipitation in the country. It is used in this context to explore areas of erosion.

http://www.environment.gov.au/soe/2001/publications/technical/wind-erosion/index.html

Isotachs

This image shows isotachs and
streamlines in the North American region. The isotachs, shown by the lines in the image, are connecting areas of equal wind speed.

http://wxmaps.org/pix/avnmr.00hr.html

Isobars

This image of Northern Europe/Greenland shows air pressure in the form of isobars. The lines link areas of similar air pressure.

http://www.halesowenweather.co.uk/pressure_charts.htm

Lidar image of Ground Zero

This is an image of the World Trade Center site taken shortly after the bombing, using a LIDAR camera. Depth and altitude are visible and clear.

http://imaging.geocomm.com/gallery/wtc-lidar092701-overview.jpg

Doppler radar image

This doppler radar image clearly shows the bands of Hurricane Andrew in 1992 in the Miami area. The colors show the intensity of different parts o the storm.

http://www.met.fsu.edu/explores/CurrCD/CURRCD-FINAL/Image%20Library/IM22-RadarMIA1992.gif

B&W Aerial Photograph

In this black and white aerial photograph, buildings, trees, and natural water features are easily distinguishable. This is due in part to the high resolution and scale, but the black and white format makes these attributes visible also.

http://online.redwoods.edu/instruct/colloquium/0607/

Aerial Infrared Photo

This infrared aerial photograph shows Tupper Lake, NY. It is shown on a website promoting the area to businesses and guests. The roads and developed areas are easy to distinguish in this photo, making it very useful in this situation.

http://www.hutchville.com/tupper.shtml

Wednesday, August 6, 2008

Burglary Statistics Map

This map shows burglary statistics in the city of Denver.  The shades indicate an increase, decrease, or no change in burglary rates for 2002.  The values of how much of a change occurred are displayed in the neighborhoods.

http://www.denvergov.org/2001_crime_stats/Burglary/Burglary2/tabid/377611/Default.aspx

Consumption Cartogram

This is a cartogram that represents consumption values of countries.  The area of the countries is stretched to show relative amount of consumption.

http://pthbb.org/natural/footprint/

Migration Flow Map

This is a flow map that shows migration patterns to California and New York.  The amount of people migrating to these areas are shown by the thickness of the lines connecting the states.  It can be inferred that more people move to New York from Eastern states, while California attracts people from all over the U.S.

http://graphics.stanford.edu/papers/flow_map_layout/

Isoline Map of East China water transfer area

This isoline map shows a water transfer area in East China.  The lines represent annual runoff depths of the area.

http://www.unu.edu/unupress/unupbooks/80157e/80157E09.htm

Proportional circle map of Missouri River

This proportional circle map shows river depth by means of circle size and water color by color shades of the circles.  The data collected by Lewis and Clark can be displayed on one understandable map by using proportional circles.

http://pubs.usgs.gov/fs/fs-004-03/

Choropleth map of hispanics in Florida

This map shows percentage of persons in each county in Florida that are Hispanic.  The darker shades of green represent larger percentages of Hispanics, with the darkest green as much as 57.3%.

http://www.ilstu.edu/~jrcarter/Geo204/Choro/Tom/

Dot distribution map of southern field cricket

This map shows known locations of Southern Field Cricket populations in dot distribution format.  It is possible to see concentrations of the species in the southeast using this map.

http://buzz.ifas.ufl.edu/482m.htm

Nazi Propaganda Map

This is a propaganda map used by the Nazis to exaggerate the threat of an invasion by Czechoslovakia.  It shows that almost all of Europe is at risk for air invasion.

http://www.newberry.org/K12maps/module_15/germ_prop.html

Monday, August 4, 2008

Hypsometric Map of Curua River

This hypsometric map is a 3-dimensional representation of the Curua river.  It uses shading to show relief in detail.  It gives the viewer a good idea of slope, but does not offer numeric values for elevation or depth.

www.esteio.com.br/english/executed/se_leme.htm

PLSS map of Franklin County Alabama

This is a PLSS map of Franklin County, Alabama.  It shows townships and ranges.

www.rootsweb.ancestry.com/~alfrankl/landrecords.htm

Cadastral map of Delaware County

This cadastral map shows Delaware County, Ohio.  It separates property in the county and outlying areas.

www.dalisproject.org/ images/cadastral_map.jpg

Thematic map of Hawaii island

A map of Hawaii Island showing types of land reserves and jurisdictions.

www.creativemappingsolutions.com/maps/thematic/thematic1.html

Topographic map of Yellowstone River

This is a topographic map of the Yellowstone River Basin.  The elevation is represented by changes in color, with darker colors being higher elevations.

www.uusatrg.utah.edu/RBSMITH/public_html/RESEARCH/ys-geodyn.html

Planimetric map of Yellowstone River

This is a planimetric map of a portion of the Yellowstone River.  This map was used by USGS to do habitat modeling.  Elevation is not shown, but being in the mountains, it can be assumed that elevation plays a factor in the river system.
smig.usgs.gov