The star plot is used to display data with multiple variables. It is possible to see the distance from zero that each variable goes and determine the variable with the most effect. This star plot is used for oil technologies.
http://www.humble-inc.com/rof_app99-2.htm
Friday, August 8, 2008
Correlation matrix
Similarity matrix
Stem and leaf plot
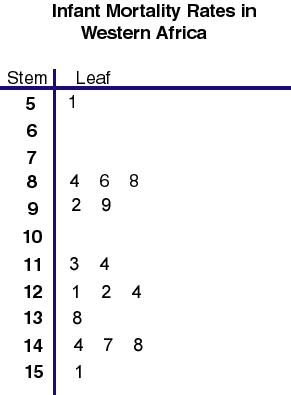
This stem and leaf plot organizes a list of data about infant mortality rates in Western Africa. The data is organized by stem (the first digit), and then by leaf (the corresponding digits). It is then possible to see how many samples share the same first digit, and also what the other digit are.
http://mainland.cctt.org/mathsummer/JosephBond/StemAndPlots/stem-and-leaf_std.htm
Boxplot
Histogram
Parallel coordinate graph
Triangular plot
Wind Rose
Climograph
Population profile
Scatterplot
Index value plot
Lorenz curve
Bialateral graph
Bivariate choropleth map
Unclassed choropleth map
Classed choropleth map
Range graded proportional circle map
Continuously variable proportional circle map
DOQQ
DEM
DLG
Digital Raster Graphic
Isopleth Map
Isohyetal Map
Isotachs
Isobars
Lidar image of Ground Zero
Doppler radar image
B&W Aerial Photograph
Aerial Infrared Photo
Wednesday, August 6, 2008
Burglary Statistics Map
This map shows burglary statistics in the city of Denver. The shades indicate an increase, decrease, or no change in burglary rates for 2002. The values of how much of a change occurred are displayed in the neighborhoods.
http://www.denvergov.org/2001_crime_stats/Burglary/Burglary2/tabid/377611/Default.aspx
Consumption Cartogram
Migration Flow Map
This is a flow map that shows migration patterns to California and New York. The amount of people migrating to these areas are shown by the thickness of the lines connecting the states. It can be inferred that more people move to New York from Eastern states, while California attracts people from all over the U.S.
http://graphics.stanford.edu/papers/flow_map_layout/
Isoline Map of East China water transfer area
Proportional circle map of Missouri River
Choropleth map of hispanics in Florida
Dot distribution map of southern field cricket
Nazi Propaganda Map
Monday, August 4, 2008
Hypsometric Map of Curua River
PLSS map of Franklin County Alabama
Cadastral map of Delaware County
Thematic map of Hawaii island
Topographic map of Yellowstone River
Planimetric map of Yellowstone River
Wednesday, May 14, 2008
Mental Map of Newyorkistan
In this example of a mental map, the artist is showing not how to get around New York City, but the elements that he or she sees as making up the city. The regions of the map are not representative of where you might find these elements, but perhaps the degree to which you may find them. http://cantuar.blogspot.com/2006/04/new-yorker-on-anglican-communion.html
Subscribe to:
Posts (Atom)